
Page 32 - MEMORIA SEFAC 2019
P. 32
Memoria anual 2019
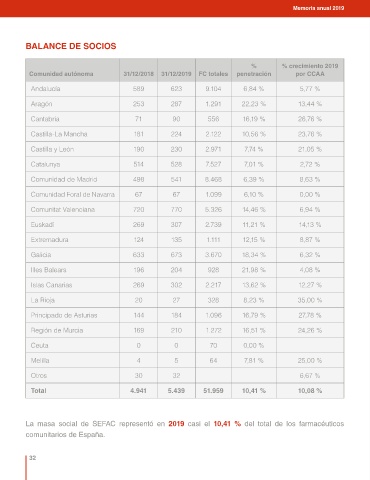
BALANCE DE SOCIOS
% % crecimiento 2019
Comunidad autónoma 31/12/2018 31/12/2019 FC totales penetración por CCAA
Andalucía 589 623 9.104 6,84 % 5,77 %
Aragón 253 287 1.291 22,23 % 13,44 %
Cantabria 71 90 556 16,19 % 26,76 %
Castilla-La Mancha 181 224 2.122 10,56 % 23,76 %
Castilla y León 190 230 2.971 7,74 % 21,05 %
Catalunya 514 528 7.527 7,01 % 2,72 %
Comunidad de Madrid 498 541 8.468 6,39 % 8,63 %
Comunidad Foral de Navarra 67 67 1.099 6,10 % 0,00 %
Comunitat Valenciana 720 770 5.326 14,46 % 6,94 %
Euskadi 269 307 2.739 11,21 % 14,13 %
Extremadura 124 135 1.111 12,15 % 8,87 %
Galicia 633 673 3.670 18,34 % 6,32 %
Illes Balears 196 204 928 21,98 % 4,08 %
Islas Canarias 269 302 2.217 13,62 % 12,27 %
La Rioja 20 27 328 8,23 % 35,00 %
Principado de Asturias 144 184 1.096 16,79 % 27,78 %
Región de Murcia 169 210 1.272 16,51 % 24,26 %
Ceuta 0 0 70 0,00 %
Melilla 4 5 64 7,81 % 25,00 %
Otros 30 32 6,67 %
Total 4.941 5.439 51.959 10,41 % 10,08 %
La masa social de SEFAC representó en 2019 casi el 10,41 % del total de los farmacéuticos
comunitarios de España.
32